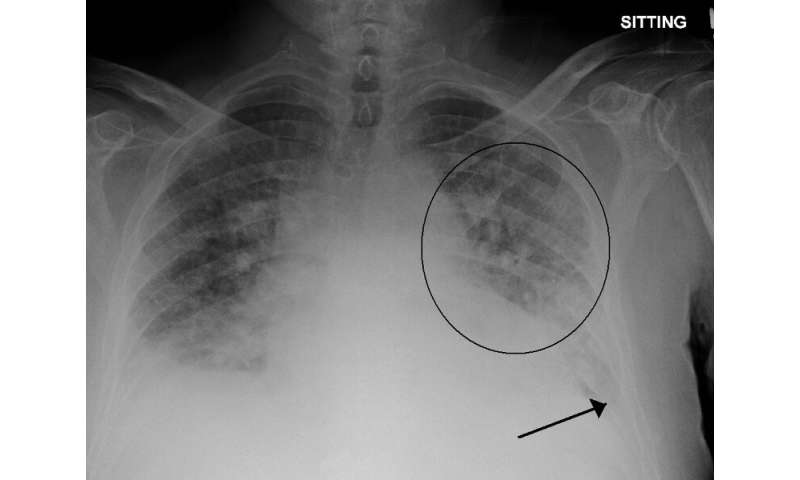
Every year, roughly one out of eight U.S. deaths is caused at least in part by heart failure. One of acute heart failure’s most common warning signs is excess fluid in the lungs, a condition known as pulmonary edema.
A patient’s exact level of excess fluid often dictates the doctor’s course of action, but making such determinations is difficult and requires clinicians to rely on subtle features in X-rays that sometimes lead to inconsistent diagnoses and treatment plans.
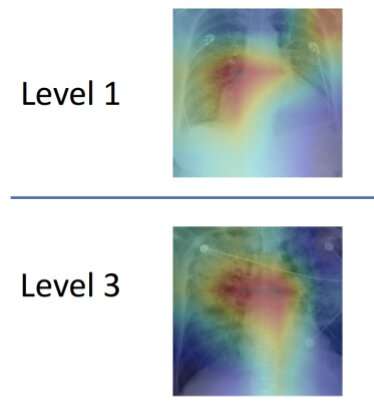
To better handle that kind of nuance, a group led by researchers at MIT’s Computer Science and Artificial Intelligence Lab (CSAIL) has developed a machine learning model that can look at an X-ray to quantify how severe the edema is, on a four-level scale ranging from 0 (healthy) to 3 (very, very bad). The system determined the right level more than half of the time, and correctly diagnosed level 3 cases 90 percent of the time.
Working with Beth Israel Deaconess Medical Center (BIDMC) and Philips, the team plans to integrate the model into BIDMC’s emergency-room workflow this fall.
“This project is meant to augment doctors’ workflow by providing additional information that can be used to inform their diagnoses as well as enable retrospective analyses,” says Ph.D. student Ruizhi Liao, who was the co-lead author of a related paper with fellow Ph.D. student Geeticka Chauhan and MIT professors Polina Golland and Peter Szolovits.
The team says that better edema diagnosis would help doctors manage not only acute heart issues, but other conditions like sepsis and kidney failure that are strongly associated with edema.
As part of a separate journal article, Liao and colleagues also took an existing public dataset of X-ray images and developed new annotations of severity labels that were agreed upon by a team of four radiologists. Liao’s hope is that these consensus labels can serve as a universal standard to benchmark future machine learning development.

An important aspect of the system is that it was trained not just on more than 300,000 X-ray images, but also on the corresponding text of reports about the X-rays that were written by radiologists. The team was pleasantly surprised that their system found such success using these reports, most of which didn’t have labels explaining the exact severity level of the edema.
“By learning the association between images and their corresponding reports, the method has the potential for a new way of automatic report generation from the detection of image-driven findings,” says Tanveer Syeda-Mahmood, a researcher not involved in the project who serves as chief scientist for IBM’s Medical Sieve Radiology Grand Challenge. “Of course, further experiments would have to be done for this to be broadly applicable to other findings and their fine-grained descriptors.”
Chauhan’s efforts focused on helping the system make sense of the text of the reports, which could often be as short as a sentence or two. Different radiologists write with varying tones and use a range of terminology, so the researchers had to develop a set of linguistic rules and substitutions to ensure that data could be analyzed consistently across reports. This was in addition to the technical challenge of designing a model that can jointly train the image and text representations in a meaningful manner.
“Our model can turn both images and text into compact numerical abstractions from which an interpretation can be derived,” says Chauhan. “We trained it to minimize the difference between the representations of the X-ray images and the text of the radiology reports, using the reports to improve the image interpretation.”
On top of that, the team’s system was also able to “explain” itself, by showing which parts of the reports and areas of X-ray images correspond to the model prediction. Chauhan is hopeful that future work in this area will provide more detailed lower-level image-text correlations, so that clinicians can build a taxonomy of images, reports, disease labels and relevant correlated regions.
Source: Read Full Article
